Elastic Is Turning Observability Migration Into a Backend Swap
Elastic is positioning its platform as a drop-in replacement for traditional observability backends by maintaining compatibility with existing workflows like PromQL and Grafana. This strategy aims to reduce the friction of migration while unifying metrics, logs, and traces to support more effective human and AI-driven investigations.

Observability platforms rarely lose customers purely on technical merit. They lose them when the pain of staying becomes greater than the pain of leaving. That second part is the obstacle. An organization may know that its metrics backend is expensive. Engineers may complain about cardinality limits. Retention may be shrinking. Queries may be slowing down. The team may want better correlation between logs, metrics, and traces. Still, switching platforms can feel worse than living with the existing problems. Years of PromQL. Hundreds of Grafana dashboards. Alert rules embedded in runbooks. Prometheus scrape configurations. Operational habits engineers rely on during incidents. That creates a powerful form of infrastructure inertia. Elastic's recent metrics work appears aimed directly at that problem. The interesting story is not merely that Elasticsearch can now compete with Prometheus, Mimir, or Datadog on metrics. It is that Elastic is trying to make changing the backend far less disruptive than changing the observability workflow. ## Observability Has a Switching-Cost Problem Technology teams often evaluate platforms through feature comparison. Storage cost. Query speed. Dashboards. Alerts. Integrations. AI capabilities. Actual migrations are governed by another variable: How much existing work gets destroyed if we move? Prometheus is a strong example. Teams accumulate years of investment around it:
text PromQL queries Grafana dashboards recording rules alert rules scrape configurations runbooks developer knowledge text Prometheus instrumentation PromQL Grafana existing dashboards alert rules text storage query backend retention economics cross-signal architecture text Instrumentation ↓ OpenTelemetry / Prometheus ↓ Storage backend ↓ Query layer ↓ Visualization ↓ Investigation agents text pod container namespace region cluster service deployment version instance customer endpoint text More dimensions ↓ More observability context ↓ More cost text Reduce dimensions ↓ Drop metrics ↓ Shorten retention ↓ Lose context text cluster = prod-west namespace = payments pod = payment-api-79c9f node = ip-10-24-8-31 version = 7.4.2 text We intentionally summarized this data text We deleted it because storing it was too expensive text Metric detects latency ↓ Trace identifies service ↓ Logs explain error ↓ Deployment event explains change text multiple SREs multiple teams hundreds of incidents 24/7 operations 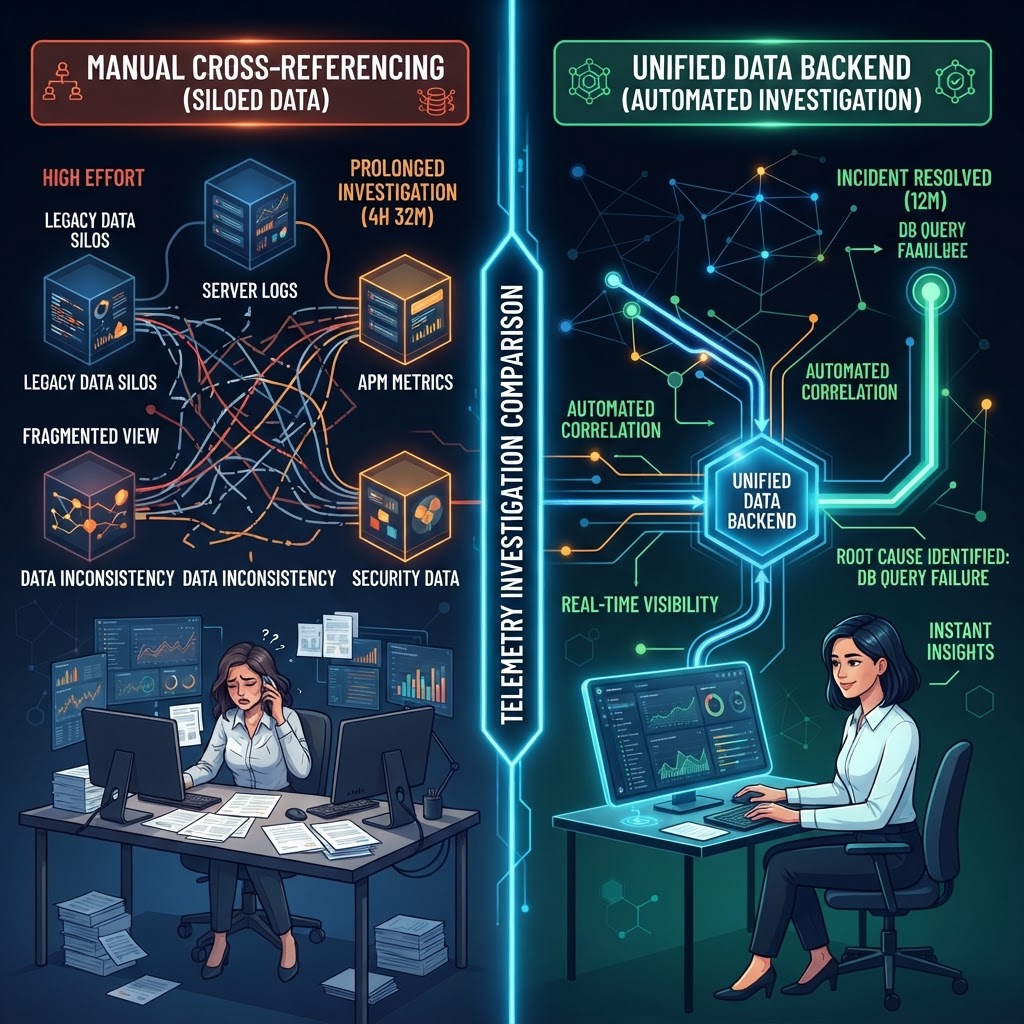
This Is Where Agentic Investigation Becomes Relevant Elastic ties the unified backend to its agentic investigation story. That connection is logical. AI investigation works best when context is already assembled. An agent trying to diagnose a Kubernetes issue may need: text pod metrics container logs deployment history service dependencies host information cloud metadata traces anomaly scores
If those live across disconnected backends, the agent inherits the same integration problem humans face. If the signals already share a backend, the investigation starts with more context. That can change AI from: text summarize this alert
into: text investigate why this alert happened
## Better AI Starts With Better Data Architecture There is a temptation to view agentic observability as primarily an LLM problem. It is more heavily constrained by data architecture. A model can reason only over what it can retrieve. If telemetry is: text sampled fragmented poorly correlated short-lived stored across several systems
the AI begins with an incomplete picture. The model may still produce a confident explanation. The evidence behind it is weaker. Elastic's unified-backend argument is therefore partly an AI argument. Keep more telemetry. Keep it together. Make it searchable. Then let agents reason over it. ## PromQL Compatibility Protects Human Capital PromQL is more than a syntax. It represents accumulated organizational knowledge. A query such as: text sum by (pod) ( rate(container_cpu_usage_seconds_total[5m]) )
may appear simple. Inside an enterprise, hundreds or thousands of these queries encode years of operational experience. They capture questions engineers learned were useful. Replacing the backend should not force teams to discard that knowledge. Native PromQL support preserves it. That makes query compatibility a form of knowledge preservation. ## Dashboards Are Operational Assets The same is true for Grafana. A mature Grafana environment contains more than charts. Dashboards frequently encode: text service ownership failure patterns capacity signals business KPIs troubleshooting paths team conventions
Recreating them is not merely UI work. It means reconstructing operational knowledge. Elastic's migration tooling attempts to move those assets rather than force teams to recreate them. The article describes tooling for converting supported Datadog and Grafana dashboards, alert rules, and PromQL queries, alongside phased migrations where Grafana can stay in place while Elasticsearch replaces the backend. That lowers one of the biggest barriers to platform change. ## A Backend Swap Creates a Different Migration Strategy Consider the traditional migration: text Old stack ↓ Build new stack ↓ Recreate dashboards ↓ Rewrite alerts ↓ Rewrite queries ↓ Retrain engineers ↓ Run both systems ↓ Cut over
Now consider the backend-first model: text Prometheus workflow ↓ Remote Write to Elasticsearch ↓ Keep Grafana ↓ Keep PromQL ↓ Validate backend ↓ Migrate other pieces gradually
That reduces blast radius. Teams can move one architectural layer at a time. That is usually safer than a full observability replacement. ## This Could Put Pressure on Datadog's Pricing Model Elastic's Datadog comparison centers heavily on custom metrics and cardinality-based economics. That is strategically important. Cloud-native environments generate custom dimensions naturally. More instrumentation can create more cost. That produces a strange incentive: The better you observe the system, the more expensive your observability system becomes. At some point, engineers start designing telemetry around billing constraints. That is a bad place to be. Observability should encourage more useful instrumentation. Pricing models that punish useful detail create tension between engineering and finance. ## The Best Observability Pricing Model Encourages Curiosity Imagine two environments. Environment A tells engineers: text Adding this dimension will increase the bill.
Environment B tells them: text Add the dimension if it helps investigation.
The second environment encourages experimentation. Teams can ask better questions. They can add richer instrumentation. They can retain historical evidence. That can improve operations over time. Pricing influences engineering behavior more than vendors sometimes acknowledge. ## Cost Optimization and Investigation Quality Can Align Historically, lowering observability cost often meant reducing visibility. Elastic is trying to argue for the opposite relationship: text Efficient backend ↓ Lower storage cost ↓ More full-resolution telemetry retained ↓ More context during incidents ↓ Better investigations
That is a far stronger value proposition than "cheaper metrics." It claims cost reduction can improve, rather than diminish, investigative context. If that holds consistently in customer environments, it changes the buying conversation. ## The Real Competitor May Be Fragmentation The article compares Elasticsearch with Prometheus, Mimir, ClickHouse, Grafana, and Datadog. The deeper competitor may be the fragmented observability stack itself. Many organizations operate something resembling: text Prometheus for metrics Loki for logs Tempo for traces Grafana for visualization another tool for alerting another system for AI
Each component may be good. The cost appears at the boundaries. Different query languages. Different storage behavior. Different retention policies. Different scaling models. Different troubleshooting processes. Fragmentation creates integration work. Elastic's unified-backend approach is fundamentally a bet that reducing those boundaries creates enough value to outweigh the appeal of specialized components. ## Open Standards Make That Bet Safer The risk of consolidation is vendor lock-in. Prometheus compatibility and OpenTelemetry help counter that concern. If instrumentation remains open, organizations can change backends later. That creates a healthier version of consolidation: text Unified backend + Open ingestion + Portable telemetry
rather than: text Unified backend + Proprietary everything
That distinction will matter to platform teams making multi-year architecture choices. ## Observability Architecture Is Moving Up the Stack The old observability question was: Where should we store metrics? The newer question is: How do we preserve enough operational context that humans and AI agents can diagnose systems quickly? That is a much broader problem. Storage architecture. Query compatibility. Telemetry standards. Retention. Cost. AI investigation. Migration. They increasingly belong in the same conversation. ## The Bigger Lesson Elastic's article contains eye-catching numbers: Up to 30 times faster queries. Up to 2.5 times better storage efficiency than Prometheus. Roughly half the Datadog cost in comparable workloads. Those claims matter. The more interesting strategy lies underneath them. Elastic is trying to make the observability backend replaceable without making the engineer's workflow disposable. Keep Prometheus instrumentation. Keep PromQL. Keep Grafana if desired. Keep existing operational knowledge. Change the storage engine. Change the economics. Unify the telemetry. Add agentic investigation later. That is a very different competitive strategy from asking teams to throw away what they already built. The strongest infrastructure migration is often not the one with the best benchmark. It is the one that lets engineers preserve the greatest amount of working knowledge while changing the weakest part underneath it. Elastic appears to understand that. And if observability continues moving toward open instrumentation and agent-driven investigation, the ability to replace the backend without replacing the workflow may become one of the most valuable capabilities in the entire stack. ### Original Source Bahubali Shetti and Vinay Chandrasekhar, Elastic Observability Labs, “Elasticsearch: best-in-class for logs, now best-in-class for metrics,” June 28, 2026. https://www.elastic.co/observability-labs/blog/prometheus-metrics-elasticsearch-faster-cheaper-datadog
text pod metrics container logs deployment history service dependencies host information cloud metadata traces anomaly scores text summarize this alert text investigate why this alert happened text sampled fragmented poorly correlated short-lived stored across several systems text sum by (pod) ( rate(container_cpu_usage_seconds_total[5m]) ) text service ownership failure patterns capacity signals business KPIs troubleshooting paths team conventions text Old stack ↓ Build new stack ↓ Recreate dashboards ↓ Rewrite alerts ↓ Rewrite queries ↓ Retrain engineers ↓ Run both systems ↓ Cut over text Prometheus workflow ↓ Remote Write to Elasticsearch ↓ Keep Grafana ↓ Keep PromQL ↓ Validate backend ↓ Migrate other pieces gradually text Adding this dimension will increase the bill. text Add the dimension if it helps investigation. text Efficient backend ↓ Lower storage cost ↓ More full-resolution telemetry retained ↓ More context during incidents ↓ Better investigations text Prometheus for metrics Loki for logs Tempo for traces Grafana for visualization another tool for alerting another system for AI text Unified backend + Open ingestion + Portable telemetry text Unified backend + Proprietary everything